


CAGR stands for Compound Annual Growth Rate. It measures the consistent annual percentage growth a value would need to get from its starting point to its ending point—assuming the growth compounds every year.
It’s widely used in finance to compare how different investments, sales figures, or business metrics have grown over time.
Excel doesn’t have a dedicated CAGR function, but there are 5 easy ways to calculate it. This guide walks through each one with real examples so you can choose the approach that works best for you.
What Is CAGR? (Compound Annual Growth Rate Explained)
A Simple CAGR Example
Imagine you invest $100 in a savings account with a 10% fixed interest rate. After year 1, you’ve earned $10 in interest—bringing your balance to $110. In year 2, interest is calculated on $110, not $100, so you earn $11 and your balance grows to $121.
This is compounding: the interest earned each year gets added to the base, so the next year’s interest is calculated on a larger amount.
After 5 years, that $100 grows to $161. Now, if all you knew was the start value ($100), end value ($161), and the number of years (5), how would you find the growth rate? That’s exactly what CAGR answers.
💡 In summary: CAGR is the steady annual growth rate that takes a value from its beginning to its end over a set number of periods—assuming growth is compounded each year.
A More Realistic CAGR Example
In the real world, growth is rarely consistent year over year. Sales might jump 15% one year and creep up just 4% the next. CAGR smooths out that variability and gives you a single, meaningful average.

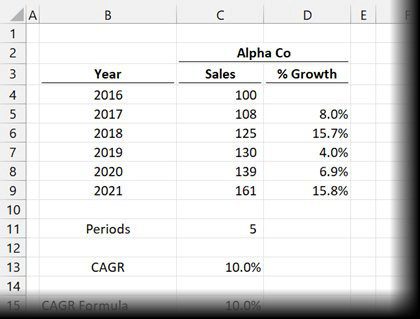
Alpha Co sales grew from $100m in 2016 to $161m in 2021—with annual growth ranging from 4.0% to 15.8%. CAGR = 10.0%
In the example above, Alpha Co’s sales grew from $100m to $161m over 5 years. Year-on-year growth ranged from 4.0% all the way to 15.8%. Yet the CAGR comes out to exactly 10%—the same as our simple savings account example, because the start and end values are identical.
Proving the CAGR Calculation
Let’s verify that a 10% CAGR over 5 years really does take us from $100m to $161m:
- Method 1: $100m × 1.1 × 1.1 × 1.1 × 1.1 × 1.1 = $161m
- Method 2: $100m × 1.1⁵ = $161m
Both methods confirm it. That’s the power of CAGR—it gives you a single, reliable rate you can use for projections and comparisons.
ALSO READ: 5 Ways to Calculate Percentage Increase in Microsoft Excel
How to Calculate CAGR in Excel—5 Methods
Excel has no built-in CAGR function, but you have five solid options. All five produce the same result—the choice comes down to your preference and the data you have available.
Method 1: The Basic CAGR Formula
The standard mathematical formula for CAGR is:
CAGR = (EV ÷ BV) ^ (1 ÷ n) – 1Where:
- EV = Ending Value
- BV = Beginning Value
- n = Number of periods between beginning and end
Applying this to Excel is straightforward once you understand the components.

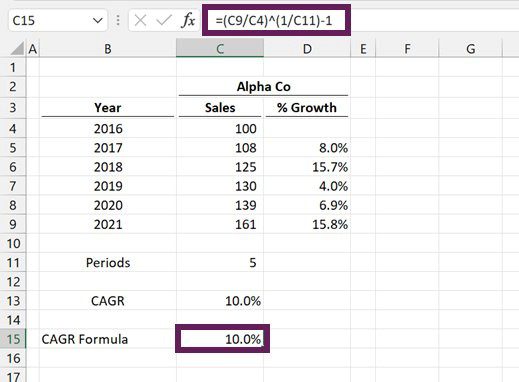
CAGR formula =(C9/C4)^(1/C11)-1 entered in cell C15, returning 10.0%The formula in cell C15:
=(C9/C4)^(1/C11)-1- C9 = 161 (Ending Value)
- C4 = 100 (Beginning Value)
- C11 = 5 (Number of periods)
Result: 10%
Method 2: The RRI Function
The RRI function is Excel’s built-in shortcut for exactly this calculation. It computes the equivalent interest rate for the growth of an investment—which is functionally the same as CAGR.
RRI Function Syntax
=RRI(Nper, Pv, Fv)- Nper = Number of periods
- Pv = Present value (Beginning Value)
- Fv = Future value (Ending Value)

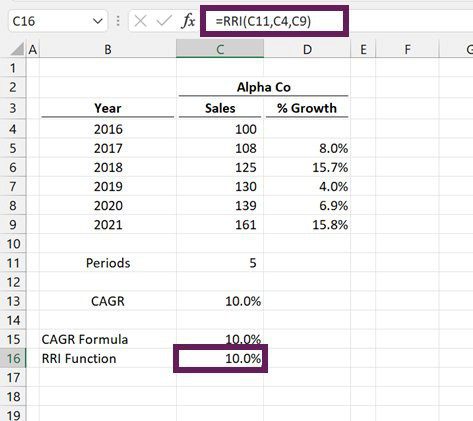
RRI function =RRI(C11,C4,C9) in cell C16, returning 10.0%The formula in cell C16:
=RRI(C11,C4,C9)- C11 = 5 (number of periods)
- C4 = 100 (Beginning Value)
- C9 = 161 (Ending Value)
Result: 10%
Method 3: The RATE Function
The RATE function is primarily designed to calculate the interest rate on a loan. With a small adjustment—making the present value negative and setting the payment to zero—it produces the same result as RRI and the CAGR formula.
RATE Function Syntax
=RATE(Nper, Pmt, Pv, [Fv], [Type], [Guess])- Nper = Number of periods
- Pmt = Consistent payment per period (set to 0 for CAGR)
- Pv = Present value—enter as a negative number
- [Fv] = Future value (optional; defaults to 0 if omitted)
- [Type] = 1 = beginning of period, 0 = end of period (optional)
- [Guess] = Estimated rate (optional; defaults to 10% if omitted)

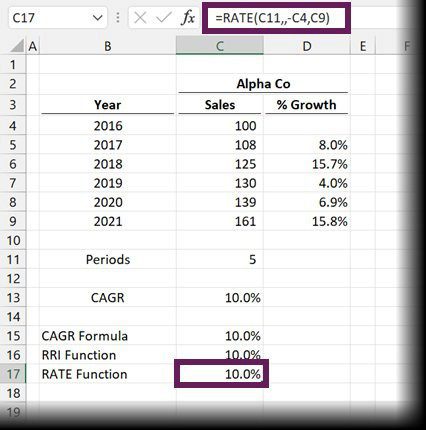
RATE function =RATE(C11,,-C4,C9) in cell C17, returning 10.0%The formula in cell C17:
=RATE(C11,,-C4,C9)- C11 = 5 (number of periods)
- -C4 = -100 (Beginning Value—must be negative for CAGR)
- C9 = 161 (Ending Value)
Result: 10%
⚠️ Key tip: Make the present value (PV) negative when using RATE for CAGR. Forgetting this will give you an incorrect result.
Method 4: The POWER Function
The POWER function is a transparent alternative that mirrors the original CAGR math exactly. It raises a number to a specified power, which is precisely what the exponent (^) does in the basic formula.
POWER Function Syntax
=POWER(Number, Power)- Number = The base number (can be any real number)
- Power = The exponent to raise the base number to

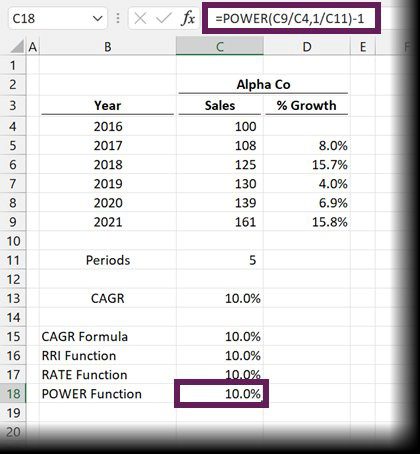
POWER function =POWER(C9/C4,1/C11)-1 in cell C18, returning 10.0%The formula in cell C18:
=POWER(C9/C4,1/C11)-1- C9/C4 = 161/100 = 1.61 (the growth ratio)
- 1/C11 = 1/5 = 0.2 (the inverse of the number of periods)
Result: 10%
If you like seeing the math behind the result, this method makes the calculation more intuitive and easier to audit.
Method 5: The GEOMEAN Function
What if you don’t have start and end values, but you do have the individual annual growth percentages? That’s where GEOMEAN comes in.
The GEOMEAN function calculates the geometric mean — the average growth rate across multiple periods, accounting for compounding. It’s the perfect tool when you have a list of year-by-year growth rates instead of absolute values.

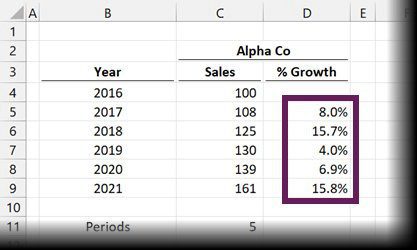
Scenario: only the annual % growth values (D5:D9) are available — no absolute sales figures
GEOMEAN Function Syntax
=GEOMEAN(Number1, [Number2], ...)- Number1 = The numbers, array, or cell range to calculate from
- [Number2]… = Up to 255 additional arguments or ranges

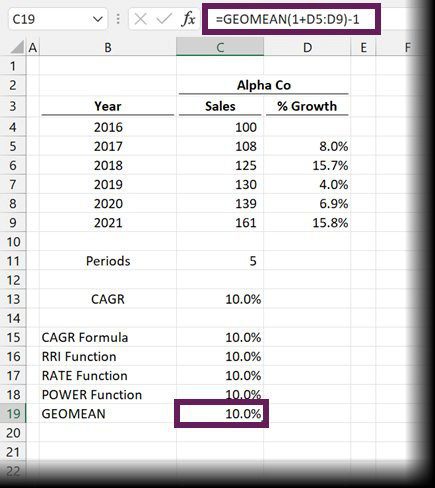
GEOMEAN formula =GEOMEAN(1+D5:D9)-1 in cell C19, returning 10.0%
The formula in cell C19:
=GEOMEAN(1+D5:D9)-1- 1+D5:D9 = Adds 1 to each percentage to convert it to a growth factor (e.g., 8% becomes 1.08)
- -1 = Subtracts 1 at the end to convert the growth factor back to a percentage
Result: 10%
⚠️ If you’re using Excel 2019 or earlier (without dynamic arrays), press Ctrl+Shift+Enter instead of just Enter to commit this formula as an array formula.
Which Method Should You Use?
| Method | Formula | Best For | Level |
| Basic Formula | =(EV/BV)^(1/n)-1 | Full control & transparency | Beginner |
| RRI Function | =RRI(n, BV, EV) | Quickest built-in option | Beginner |
| RATE Function | =RATE(n,,-BV,EV) | Finance/loan context | Intermediate |
| POWER Function | =POWER(EV/BV,1/n)-1 | Auditable math approach | Intermediate |
| GEOMEAN Function | =GEOMEAN(1+rates)-1 | When you have % rates only | Intermediate |
Frequently Asked Questions
Does Excel have a built-in CAGR function?
No—Excel doesn’t have a dedicated CAGR function. However, the RRI function is the closest equivalent, and you can also calculate CAGR using the basic formula, RATE, POWER, or GEOMEAN depending on your data.
What is the CAGR formula in Excel?
The standard CAGR formula in Excel is =(Ending Value / Beginning Value)^(1 / Number of Years) – 1. Format the result cell as a percentage to display it correctly.
What’s the difference between CAGR and average growth rate?
A simple average growth rate adds up all annual rates and divides by the number of years. CAGR accounts for compounding—it gives you the single consistent rate that would produce the actual start-to-end change. CAGR is more accurate for real-world investment and sales analysis.
Can I use CAGR for periods shorter than a year?
Yes. The ‘n’ in the CAGR formula represents the number of periods, not necessarily years. If you’re working with monthly data, set n to the number of months, and the result will be a monthly compound growth rate.
Final Thoughts
Calculating CAGR in Excel is simpler than it sounds. Whether you prefer the manual formula for full transparency, the RRI function for speed, or GEOMEAN when you only have annual growth rates — all five methods give you the same accurate result.
Once you know CAGR, you’ll find yourself using it constantly: comparing investment performance, evaluating business growth, or benchmarking metrics over any time period.
Pick the method that fits your workflow and start getting more insight from your Excel data today.