


“Do I need fancy software to track my inventory, or can I just build something in Excel?” is a question that every expanding business eventually asks itself, whether you’re running a small business, a warehouse, or even just a home-based Etsy shop.
The good news is that Excel is capable of handling inventory management; in fact, it’s a better place to start for a lot of small and mid-sized businesses. You have total control over how the system operates, you don’t need to train your staff on new software, and you don’t require a monthly subscription. From the first blank sheet to a fully automated tracker with low-stock alerts, this guide shows you exactly how to create a dependable, functional inventory management system in Excel.
Why Use Excel for Inventory Management?
It’s important to address the why before moving on to the how. There is a place for dedicated inventory software, particularly when handling thousands of SKUs in several warehouses. However, Excel offers significant benefits for smaller operations:
- Cost: Excel can be purchased separately or included in a Microsoft 365 subscription, which you probably already have.
- Flexibility: The system is built around your real workflow, not the other way around.
- Familiarity: Training time is reduced because most employees are already familiar with the fundamentals.
- Scalability for small-to-medium volume: Before performance becomes a problem, a well-designed spreadsheet can easily manage a few thousand line items.
The drawback is that, unlike cloud software, Excel does not automatically sync with your point-of-sale system or update in real time across multiple users. However, that restriction seldom becomes an obstacle for a small team or a single location.
ALSO READ: How to Create a Sales Dashboard in Excel

What You’ll Require Before Beginning
Although you don’t need to be an expert Excel user to follow along, familiarity with simple formulas is helpful. What to prepare is as follows:
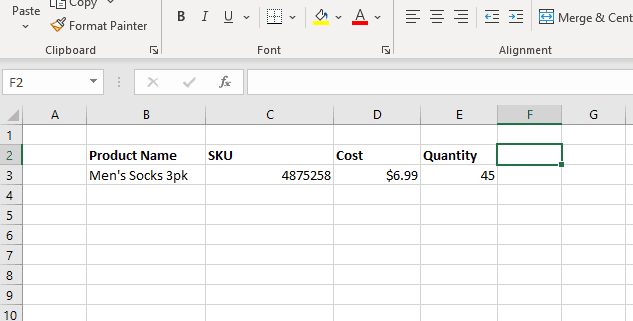
- A list of every item or product you carry, along with the item number or SKU.
- Initial amounts for every item.
- Reorder points (the amount you must replenish).
- Supplier details (if you wish to monitor purchases as well).
The build will go much more quickly if this information is collected in advance.
Step 1: Create a Spreadsheet Structure
Planning the structure before beginning construction is a common error. Three to four distinct sheets (tabs) within a single workbook are usually used in an effective Excel inventory system:
- The core sheet that lists every item, its specifications, and the current stock level is called the inventory master list.
- Stock In: a record of each shipment or replenishment that arrives.
- Stock Out: is a record of all sales, uses, and inventory removals.
- Dashboard/Summary: is a graphic summary that pulls information from the other sheets.
By keeping these tasks apart, you can avoid overwriting historical data each time stock changes and maintain a clean master list.
Step 2: Build the Inventory Master List
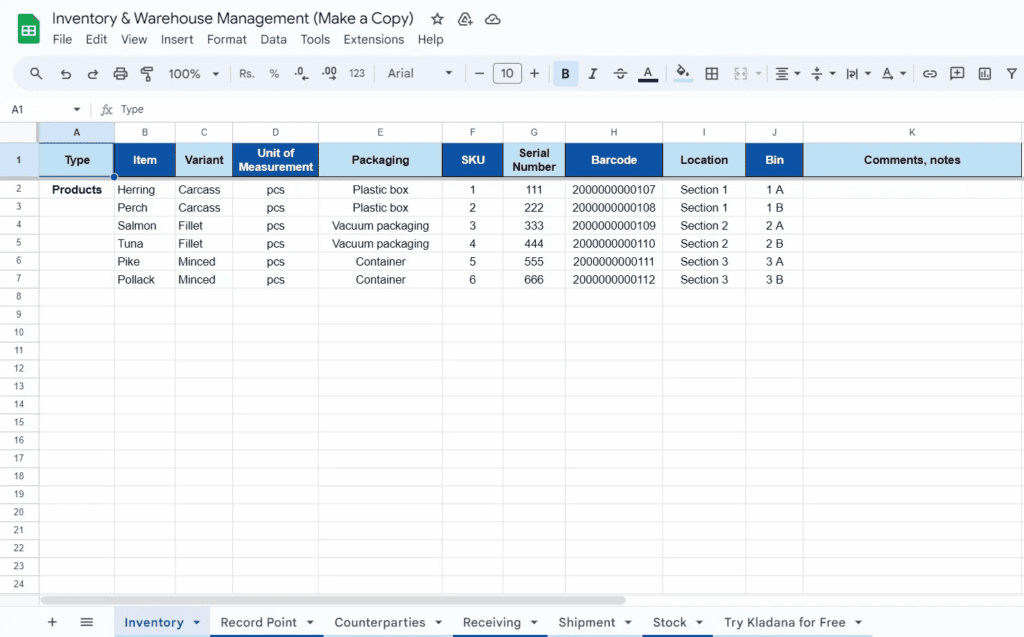
This is the heart of your system. Create column headers across the top row of your first sheet:
| Column | Purpose |
|---|---|
| SKU/Item Code | Unique identifier for each product |
| Item Name | Description of the product |
| Category | For grouping and filtering |
| Unit of Measure | Each, box, kg, liter, etc. |
| Current Stock | The quantity on hand |
| Reorder Level | The threshold that triggers a restock |
| Reorder Quantity | How much to order when restocking |
| Unit Cost | Cost per item |
| Total Value | Current Stock × Unit Cost |
| Supplier | Who you order from |
| Last Updated | Date of last change |
To keep your headers visible while scrolling through longer lists, freeze the top row (View > Freeze Panes > Freeze Top Row).

Step 3: Configure Data Verification
The main cause of inventory spreadsheets breaking down over time is data entry errors. Typos and inconsistent entries are avoided before they occur thanks to data validation.
For instance, to include a dropdown list in your Category column:
- Choose the range of columns.
- Navigate to Data > Data Validation.
- Select “List” as the criterion.
- Use commas to separate your category choices, or consult a different list on a hidden sheet.
The Unit of Measure and Supplier names should be treated similarly. This maintains the cleanliness of your data and increases the dependability of filtering and reporting in the future.
RELATED: How To Use IF Function in Excel
Step 4: Make Stock Calculations Automatically
Excel starts doing actual work for you at this point. Use formulas that pull from your Stock In and Stock Out logs rather than manually updating the Current Stock column each time something changes.
Use columns such as Date, SKU, Quantity, and Reference/Notes on your Stock In and Stock Out sheets.
Next, use a SUMIF formula to automatically determine current stock on your Master List:
=Starting_Stock + SUMIF(StockIn!B:B, A2, StockIn!C:C) - SUMIF(StockOut!B:B, A2, StockOut!C:C)This formula takes your initial quantity, adds all of the stock that has been recorded as incoming for that SKU, and subtracts all of the stock that has been recorded as outgoing. The Current Stock column automatically updates as long as your team consistently logs transactions.
Step 5: Use Conditional Formatting to Add Low-Stock Alerts
When something needs to be fixed, a working inventory system should alert you without requiring you to search for it. This is effectively handled by conditional formatting.
- Choose the column for your current stock.
- Navigate to Home > New Rule > Conditional Formatting.
- Select “Format cells that contain” and enter “less than or equal to” as the condition for your Reorder Level cell.
- Select a fill color, like orange or red.
Restocking decisions are now clear at a glance rather than requiring manual calculations because any item that falls to or below its reorder point will visually stand out.
Add a helper column with a formula such as this for an additional layer:
=IF(CurrentStock<=ReorderLevel, "Reorder Now", "OK")This enables you to narrow down the entire sheet to only the things that require attention.
Step 6: Construct a Basic Dashboard
A dashboard sheet transforms raw numbers into decisions once your data is flowing properly. Typically, a helpful inventory dashboard consists of:
- Total value of the inventory (SUM of the Total Value column).
- Items below the reorder threshold (COUNTIF).
- Top categories based on quantity or value.
- A straightforward pie chart or bar that displays the distribution of stocks by category.
Instead of creating manual summaries, use PivotTables, which only require a few clicks to set up and automatically update when your master list changes (Insert > PivotTable).
Step 7: Keep Your Information Safe
Protecting the structure becomes important once the system is operational and used by numerous users. To prevent inadvertent overwriting, lock your formula cells:
- Choose the cells where formulas are present.
- Format Cells > Protection > Verify > Protect Sheet.
- Check “Locked” and, if necessary, set a password.
This protects your primary calculations from unintentional changes while still enabling data entry in the Stock In/Stock Out logs.
Step 8: Maintain the System Going Forward
The quality of a spreadsheet depends on the habits that underlie it. To maintain the accuracy of your inventory system over time:
- Record each transaction on the day it occurs.
- Every month or every three months, physically count the stock and compare the results to the spreadsheet.
- To maintain a manageable file size, periodically archive previous Stock In/Stock Out entries.
- Make regular backups of the file, preferably to cloud storage services like Google Drive or OneDrive.
Common Mistakes to Avoid
- Ignoring the planning phase and producing a single, disorganized sheet that combines totals and logs.
- Stock levels are manually entered rather than using formulas, which causes the spreadsheet and reality to diverge.
- Lack of a backup system puts you at risk of losing everything with just one corrupted file.
- Overcomplicating it early on: once the fundamentals are functioning consistently, add features like barcode lookup (using VLOOKUP or INDEX/MATCH).
Final Thoughts
The goal of developing an Excel inventory management system is to create something dependable that your team will genuinely use on a regular basis, not to create something ostentatious. Establish a clear structure at the outset, automate the computations that are simple to automate, add visual cues for areas that require attention, and develop positive data-entry habits around it. If you do that, your system will grow with your company much longer than most people anticipate.